Let's face it: not every web application needs or can afford automated testing. This is especially true if you're working on smaller projects or building web apps for clients where continuous development isn't the main focus.
In these cases, manual testing is often your best bet. It's exactly what it sounds like – you or someone on your team goes through the web application, testing it hands-on. You're looking to answer questions like: Does everything work as it should? Can you spot any bugs?
Now, I understand. Manual testing can be incredibly time-consuming, and it's not exactly anyone's favorite task. But here's the thing: it's crucial for ensuring your web app meets all quality standards. It lets you perform end-to-end testing that can catch issues automated tests might miss.
Picture this scenario: you're testing a web application and you've just found a bug. Here's what typically happens next:
- You need to grab a screenshot or recording to show the developer what's going on.
- Then you've got to collect all the technical details – browser type, operating system, and device information.
- Describe the bug in words and how to replicate it.
- Finally, you put together a bug report in your project management tool and assign it to the right developer.
No wonder manual testing isn't everyone's favorite task.
But don't worry – we're not just here to tell you how challenging it can be. There are ways to make this process more efficient and effective.
In this article, we're going to explore 5 manual testing tools for web applications. These tools offer various features and approaches to make manual testing easier, more efficient, and significantly less painful compared to testing without any tools.
1. Feedbucket
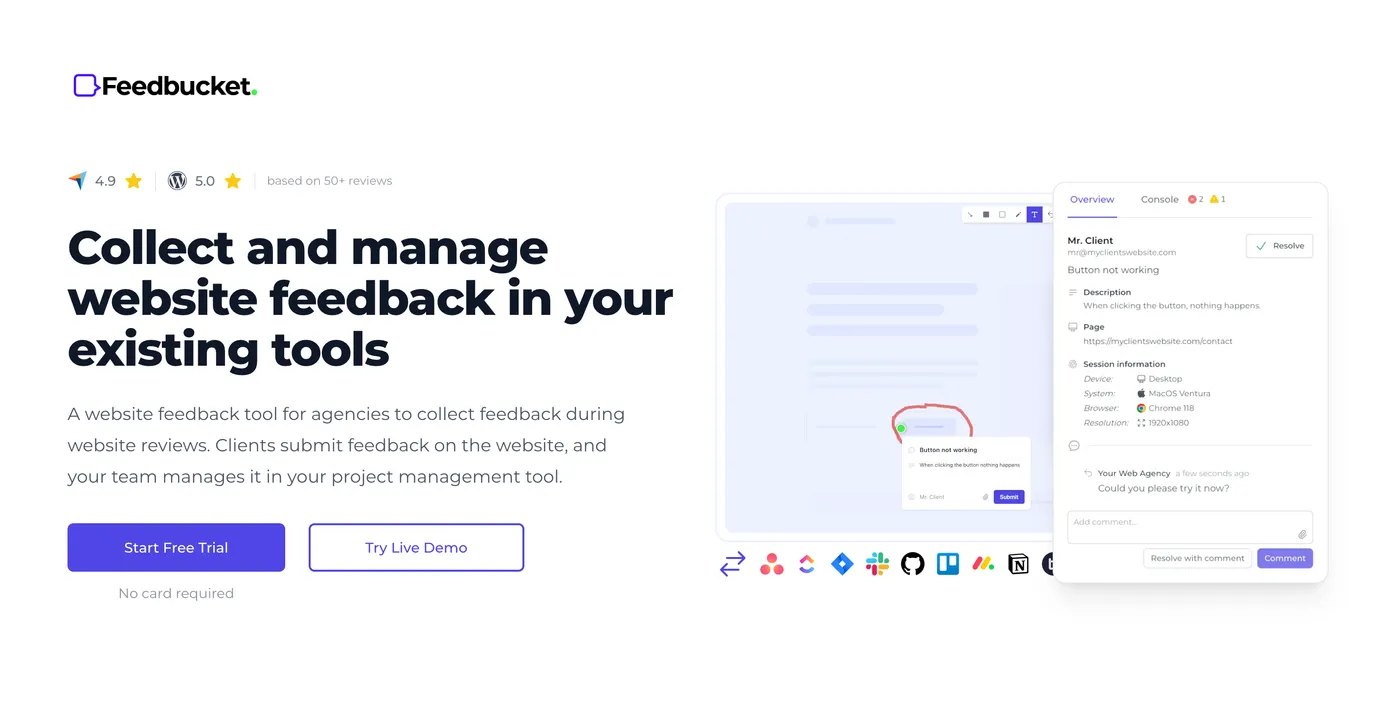
The first tool on our list is our own creation, Feedbucket. Let me give you some context: before developing Feedbucket, I ran a web agency where we built web applications for clients.
Many of these projects were substantial, often spanning several months. However, most didn't require continuous development. Once we delivered the web app to the client, our focus shifted to regular maintenance and bug fixes.
In this scenario, the resources and necessity for automated testing or a dedicated QA team simply weren't there. So, we relied on a combination of thorough code testing and manual testing of the web applications - or as it's known in technical terms, "Usability testing."
It was through this process of manually testing all our web apps that we realized the need for a better solution. That's when we created Feedbucket.
We developed Feedbucket based on two key observations:
- Collecting all the necessary details to provide context for developers is incredibly time-consuming and, let's be honest, not very exciting.
- All findings need to be entered into a project management tool, which is where collaboration happens and statuses are tracked.
As we've discussed, manual testing of web applications involves collecting a lot of contextual information when you find a bug or something that doesn't work according to the spec. This process can be tedious and time-consuming.
Let's take a closer look at how Feedbucket can you with that.
Report bugs directly from the web app with automatic detail capture
You start by installing Feedbucket on your web application (often on the staging site) using a simple script tag. This approach ensures Feedbucket is available everywhere - whether you're testing on a phone or using BrowserStack, Feedbucket is right there with you.
Once installed, you have two powerful ways to report bugs without ever leaving your browser:
- Marking up the web app and sending visual feedback
- Recording a video, with or without audio (think of it as having Loom embedded in your web app)
Let's break these down:
Annotated screenshots
Imagine you've spotted a calculation error in the web app resulting in the dreaded NaN value. Here's what you do:
- Open the Feedbucket bug report feature
- Click on the bug location
- Use annotation tools to highlight the issue (like drawing a rectangle around the NaN value)
- Add a brief description
- Hit enter
And just like that, you're done. See it in action below.
But here's where the magic happens behind the scenes. Feedbucket automatically captures:
- A screenshot of the current page
- The specific page URL
- Browser details
- Console log errors
- Operating system information
- Device type
- Screen resolution
- And much more
All this information is packaged neatly with your report, giving developers everything they need to understand and replicate the issue.
Video recording
Some bugs are just hard to explain with text and screenshots. Think of an animation glitch or a misbehaving image carousel. That's where video recording comes in handy.
With Feedbucket, you can record a video of the bug in action. You can choose to include audio narration or keep it silent. The best part? This feature works right in your browser - no additional software or browser extensions required. Simply hit the record button, demonstrate the bug, and you're all set.
These features are designed to reduce the tedious and time-consuming aspects of manual testing. By automating the capture of technical details and simplifying the reporting process, Feedbucket allows you to focus more on actual testing and improving your web application, rather than getting bogged down in documentation tasks.
Set labels and assign team members when submitting reports
When you're testing a web application, you'll encounter various types of issues. Some might be design-related, others could be functionality problems, and a few might only affect the admin interface. This is where labels become invaluable, allowing you to categorize the issues you uncover during your manual testing.
With Feedbucket, you have the option to set a label when you create a new issue. What's particularly useful is that this label is automatically carried over to your project management tool.
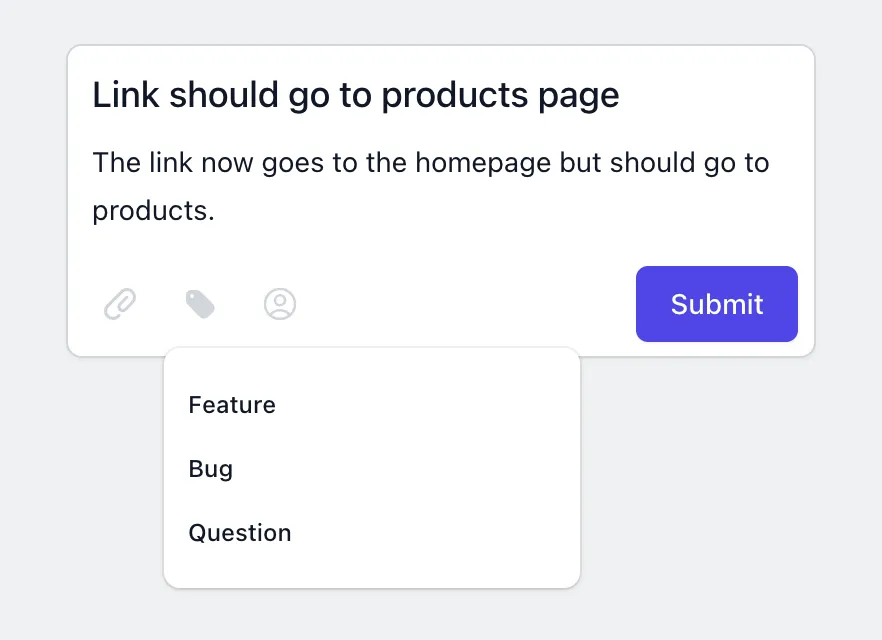
But there's more to it. Perhaps you already know exactly who needs to tackle this bug? No problem. You can assign the issue to a team member right when you submit the bug report. Just like with labels, this assignment will be reflected in your project management tool.
Here's what we're aiming for: when you're immersed in manual testing, you shouldn't have to constantly switch between your web application and other tools. Everything you need should be right there on the web app, making the process as fast and easy as possible.
Now, I won't go so far as to say this makes manual testing enjoyable - that might be stretching it a bit. But it certainly takes a lot of the hassle out of the process.
By keeping everything you need at your fingertips, Feedbucket helps you focus on what really matters: finding and reporting issues that will improve your web application.
Visualize unresolved issues directly on the web app
We've covered how to submit your findings during manual testing, but let's address another common challenge: how do you avoid submitting duplicate reports or keep track of what still needs fixing?
When you're deep in testing, especially with a team, it's easy to end up with duplicate feedback and bug reports. The reason is simple: constantly switching between your web app and project management tool to check what's already been reported is cumbersome and time-consuming. This back-and-forth often leads to testers reporting issues that someone else has already identified.
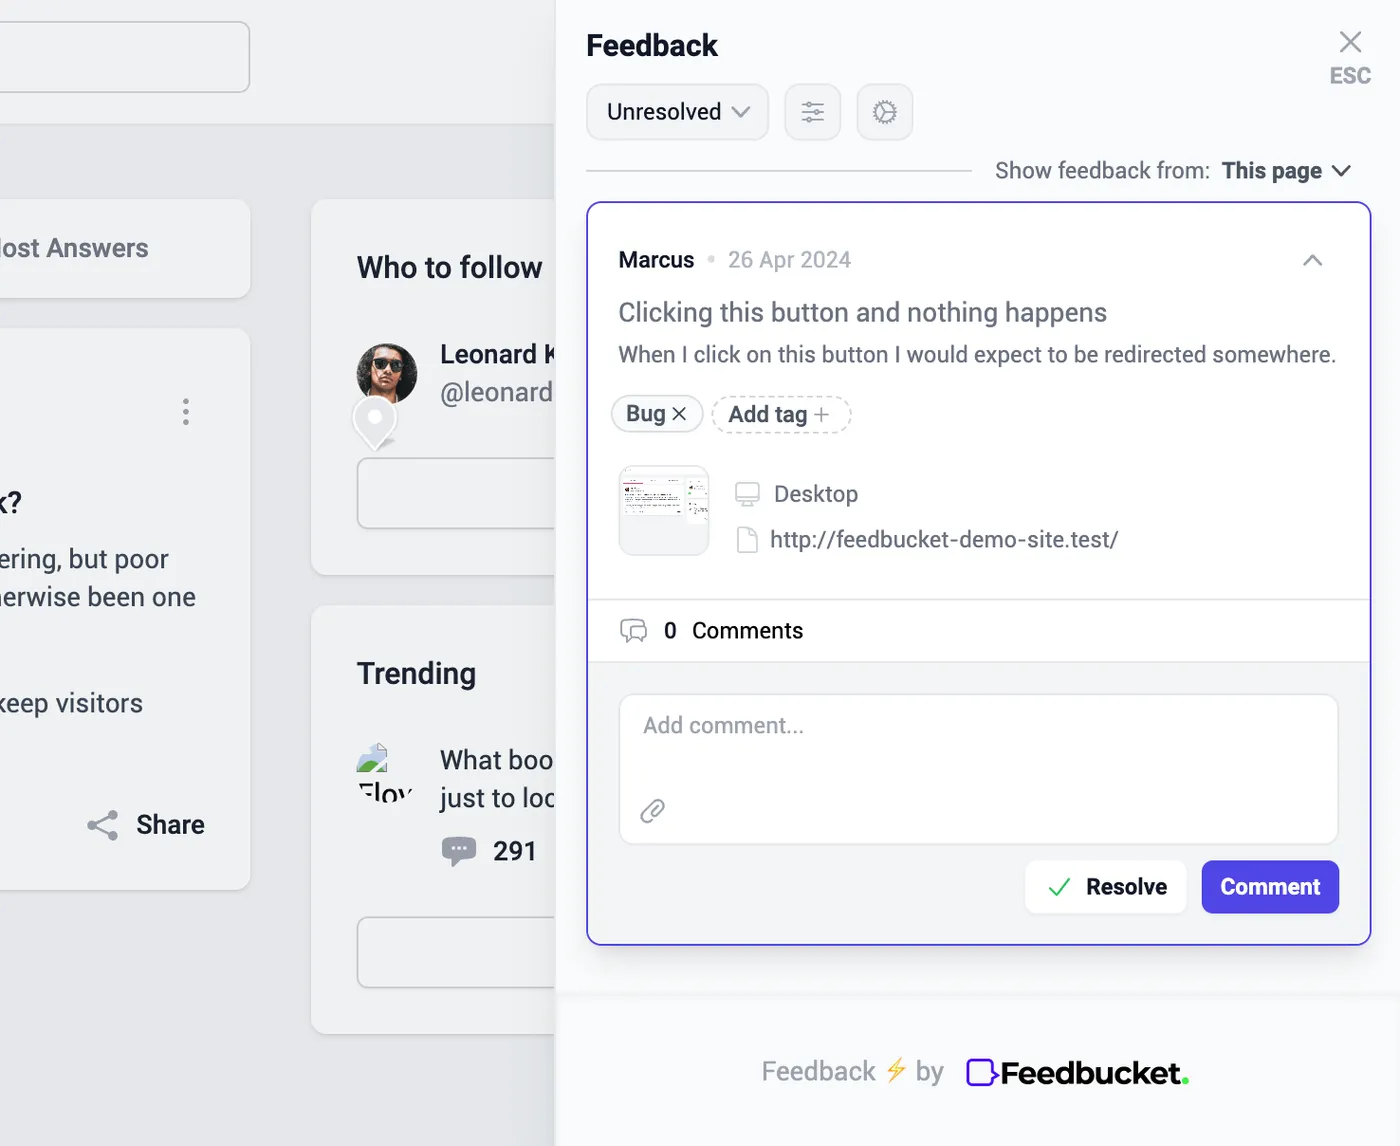
We addresses this problem by placing pins directly on your web application, marking the spots where someone has left feedback or reported an issue. Need to know more about a particular issue? Just hover over the pin for a quick summary.
.webp)
When you click on a pin, it opens up the embedded guest portal. This feature gives you a quick overview of all reported issues, neatly sorted into resolved and unresolved categories.
But that's not all. You'll notice that you can also communicate and collaborate with your team right here, discussing specific issues as needed. And don't worry about your project management tool getting out of sync - these comments are automatically sent to your project management tool.
Why is this important? We're always aiming to minimize context switches. Instead of moving back and forth between your web app and project management tool just to add a comment, you can do it all right here, without losing focus on your testing.
Manual reports automatically sync with your project management tool
We've touched on this a lot already, but it's worth emphasizing. Most of the time, you want your manual test reports to end up in your project management tool. After all, that's where you track tasks, assign responsibilities, set timelines, and manage various other aspects of your team's workflow.
When you submit a report through Feedbucket, it creates a task in your project management tool directly from the website, complete with all the necessary details. You have control over the configuration - you decide which project the tasks should be assigned to, what statuses should be used, and any other specific details you want Feedbucket to set.
Once you've set up this configuration, you're good to go. No more manual copying and pasting of information between your testing environment and your project management tool.
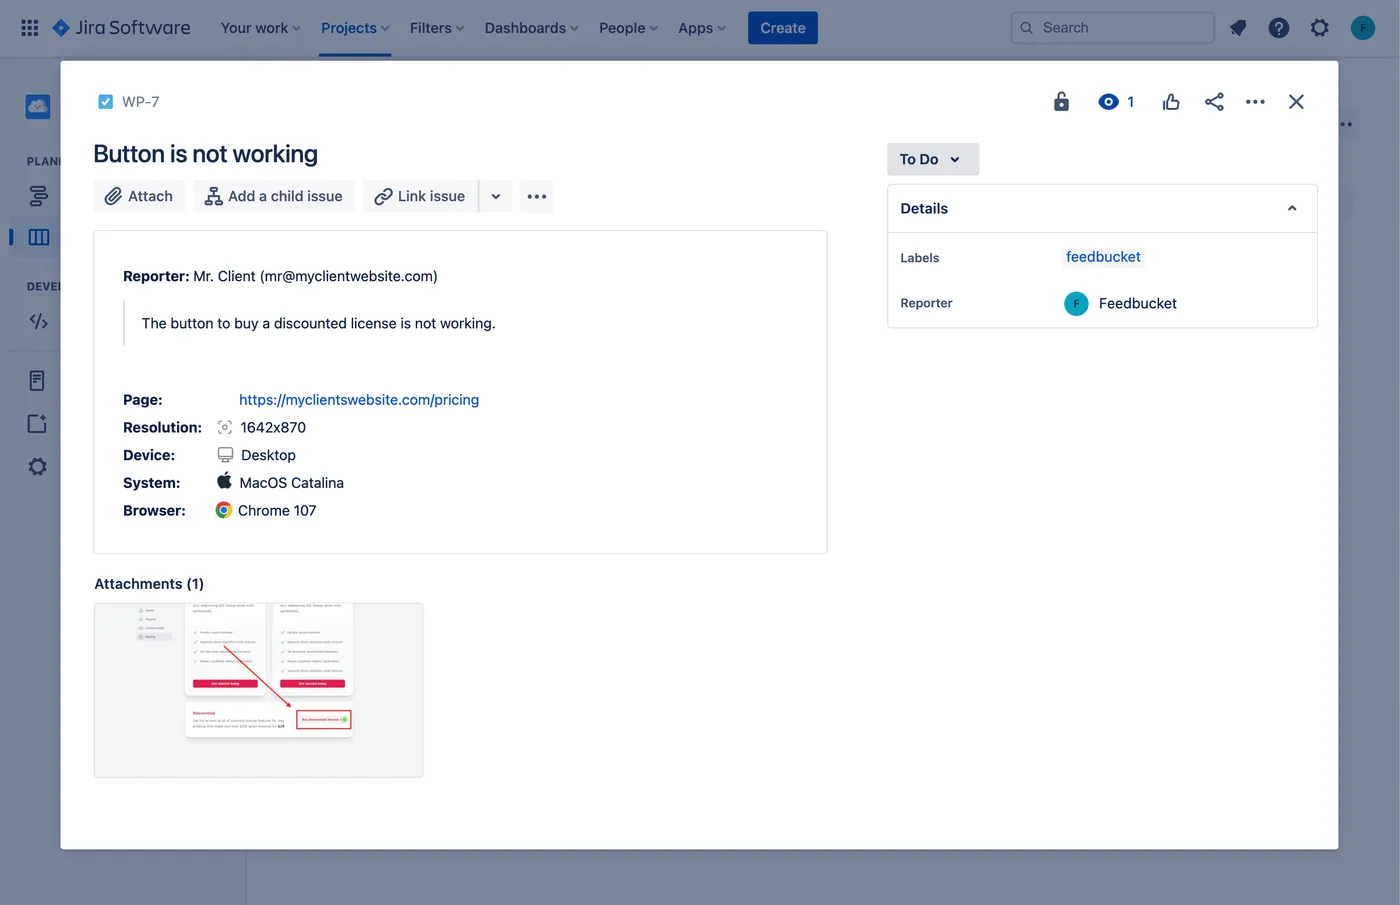
Let's take a look at how this works in practice. Below, you can see an example of an issue created in JIRA from a Feedbucket report:
But wait, there's more to this integration story. Sending manual reports to your project management tool is just the first step. Feedbucket actually establishes a two-way sync between your web application and your PM tool.
What does this mean for you? Let's break it down with a couple of examples:
- Label Updates: Imagine a tester submits a report with the label "Potential bug". Your team reviews it and decides it's definitely a bug, changing the label to "Bug" in the PM tool. Guess what? This change syncs back to Feedbucket, updating the label there as well.
- Task Completion: When your team finishes addressing an issue and marks it as "Done" in the PM tool, this status update syncs with Feedbucket too. The issue is marked as resolved, and the corresponding pin is removed from the web app.
This two-way sync ensures that everyone on your team - whether they're working directly in the PM tool or on the web application - always has the most up-to-date information.
So, if you are manually testing a web application, especially as an agency building for clients, Feedbucket could make your life a lot easier.
Try it yourself for a 14-day free trial, no credit card needed to see if it could help you as well.
Feedbucket pricing
- Pro Plan at $49 per month. The Pro Plan gives you five projects and feedback collection, two team members, integration with existing tools, and all core features for efficient manual testing.
- Business Plan at $89 per month. The Business Plan includes everything in Pro, plus unlimited projects, 25 team members, advanced features like console log recording and custom branding for more comprehensive testing capabilities.
Try Feedbucket yourself with a 14-day, no credit card needed, free trial.
2. BrowserStack
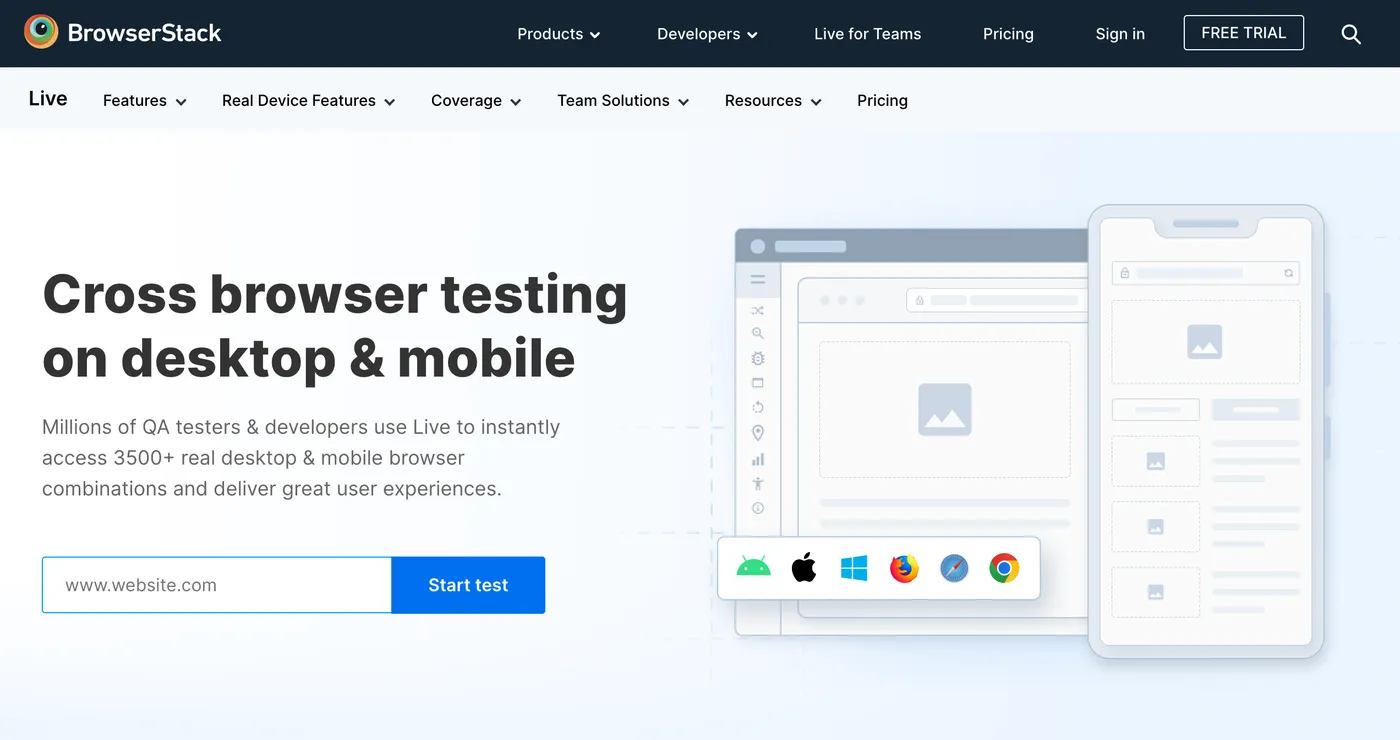
BrowserStack is an awesome tool to manually test your web application in a bunch of different browsers and environments.
All of us that have built web apps know that what works in Chrome doesn't necessarily work in Safari, or vice versa. Therefore, it's crucial to manually test the web application in all different browsers and setups where your users will be.
Doing this is kind of hard though. You would need to have all different devices and browsers physically. Or, you use BrowserStack where you can easily access over 3500+ real desktop & mobile browser combinations.
This comprehensive approach helps ensure your application works smoothly across various platforms, catching potential issues before your users encounter them.
BrowserStack pricing
BrowserStack Live offers three plans, but for most manual testing needs, one of the two lower-tiered options should suffice:
- Desktop at $39 at month. This plan allows you to manually test your web application on over 3000+ desktop browsers, along with several other useful features.
- Desktop & Mobile at $49 a month. This plan is likely the best fit for comprehensive testing. In addition to desktop browsers, it provides access to 30,000+ real iOS & Android device units, allowing you to manually test on mobile devices as well.
For teams, the price goes up quite a bit.
3. Bugzilla
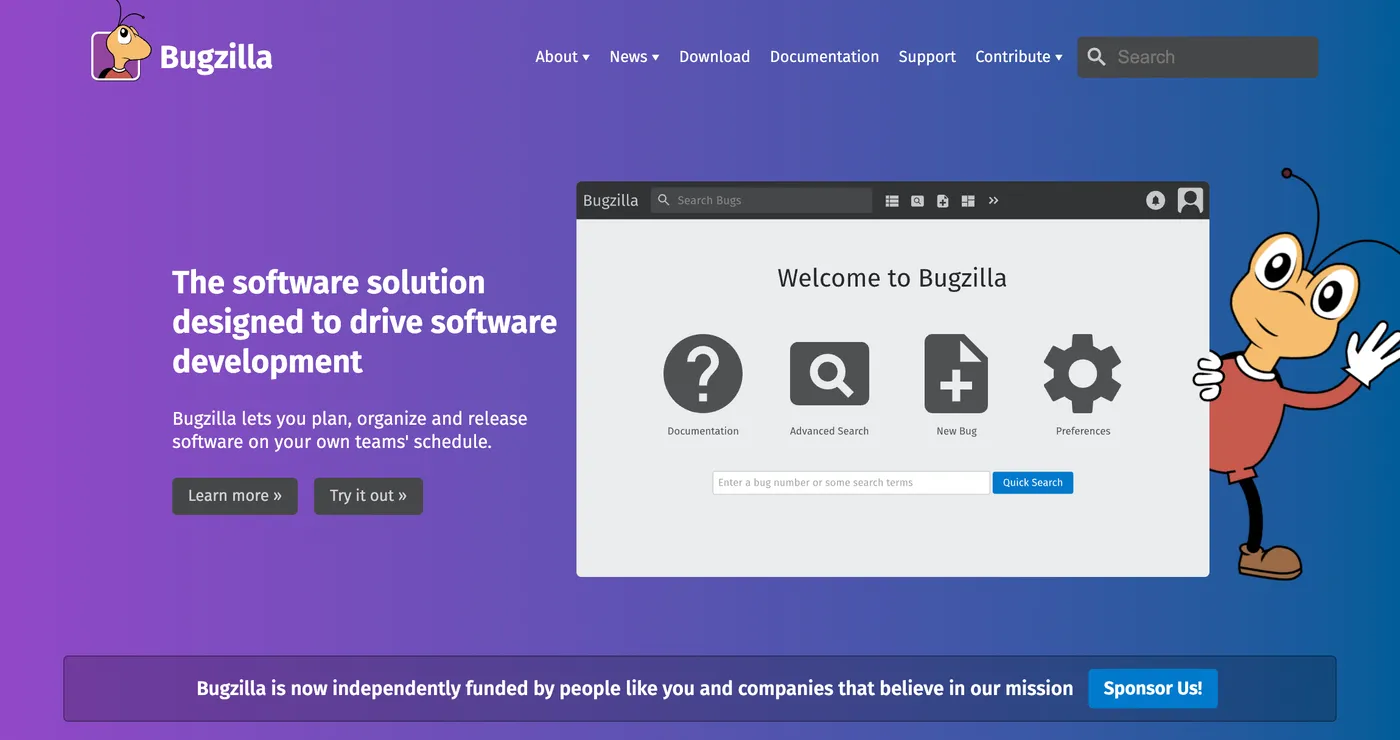
BugZilla is an open-source issue tracking system, independently funded by individuals and companies who use the tool.
It's important to note that BugZilla functions more as a project management tool than a dedicated manual testing solution. It provides a web-based system where you can manually log bugs found in systems to keep track of them.
So, think of it more like JIRA.
One interesting feature of BugZilla is the ability to associate every line of code with a specific bug. This makes it particularly well-suited for other open-source projects, rather than closed-source systems like web applications developed for clients.
BugZilla pricing
Since BugZilla is an open source it's free of charge.
4. Marker.io
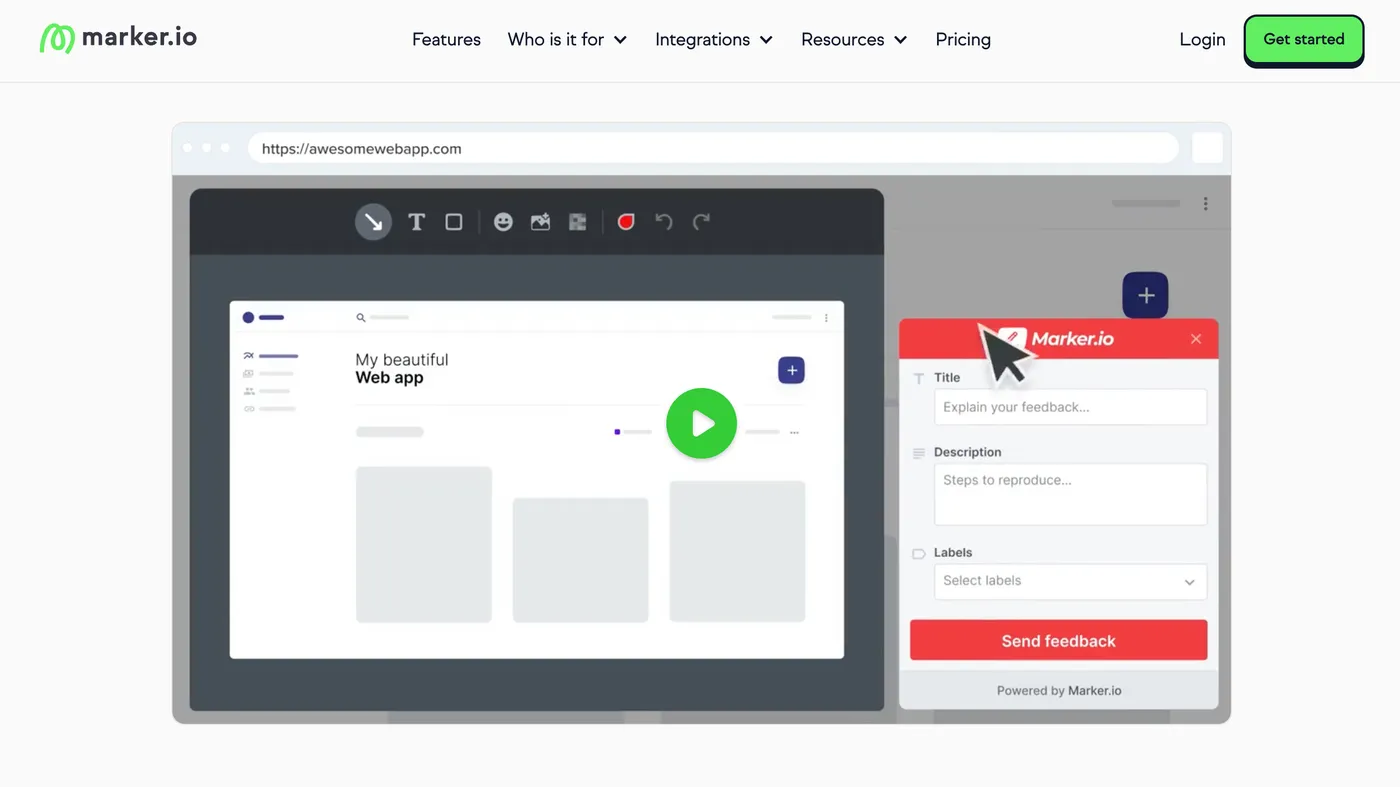
Marker.io is a bug tracking tool that enables your team to submit bug reports directly from the website. While they offer a browser extension, you can also install the tool directly on your web app.
One standout feature is their Session Recording. This captures a 30-second recording of user actions leading up to bug submission, providing valuable context for developers to understand what triggered the issue.
However, it's worth noting that Marker.io doesn't offer video recording for feedback submission. This can make it challenging to report bugs related to forms or animations, where visual demonstration is often crucial.
Marker.io pricing
Marker.io offers two pricing tiers, but for comprehensive manual testing, you'll likely want to consider their Team plan:
- Starter at $59 a month. This plan allows you to submit bug reports directly from the website and includes strong integrations with other tools.
- Team at $199 a month. This is probably the plan you'd want for manual testing. It includes additional features like console log capture, network request tracking, session replay, issue-sync with integrations and other valuable tools for thorough manual testing.
5. Apache JMeter
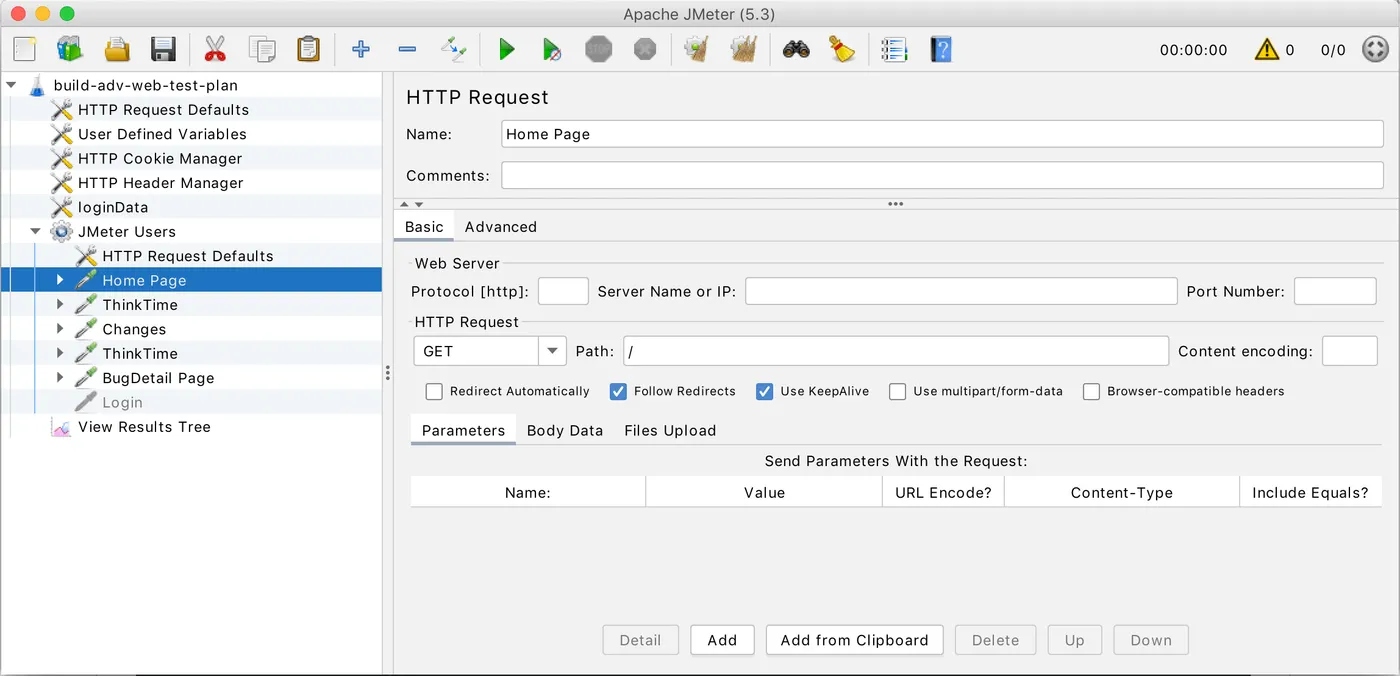
Apache JMeter is an open-source performance testing tool that allows you to test your web application under heavy load.
I was initially hesitant to include a performance testing tool in this list of manual testing tools. However, JMeter is such a great tool, and load testing is something you might do once or twice in your testing process, so I decided it had a place on this list.
With JMeter, you can simulate user behavior and send a high volume of traffic to your web app. This helps you identify where your application might break under pressure and how your infrastructure handles increased load.
While JMeter is relatively easy to set up, it also boasts a robust community that can provide support if needed.
If you're developing an application expected to handle a large number of users, I highly recommend running load tests with JMeter. For larger enterprises, LoadRunner might be another option to consider.
Apache JMeter Pricing
Since it's open source, it's free of charge.

Other related articles

Feedback with no fuss.
Start your 14-day trial. No credit card needed.
